Problem Statement
A leading e-commerce platform faced substantial challenges in maintaining optimal application performance while scaling its operations. As the platform expanded its user base, it encountered intermittent slowdowns, erratic response times, and difficulty pinpointing the root causes of performance bottlenecks. The lack of comprehensive visibility into their application’s performance became a significant obstacle in delivering a seamless user experience.
Solution Overview
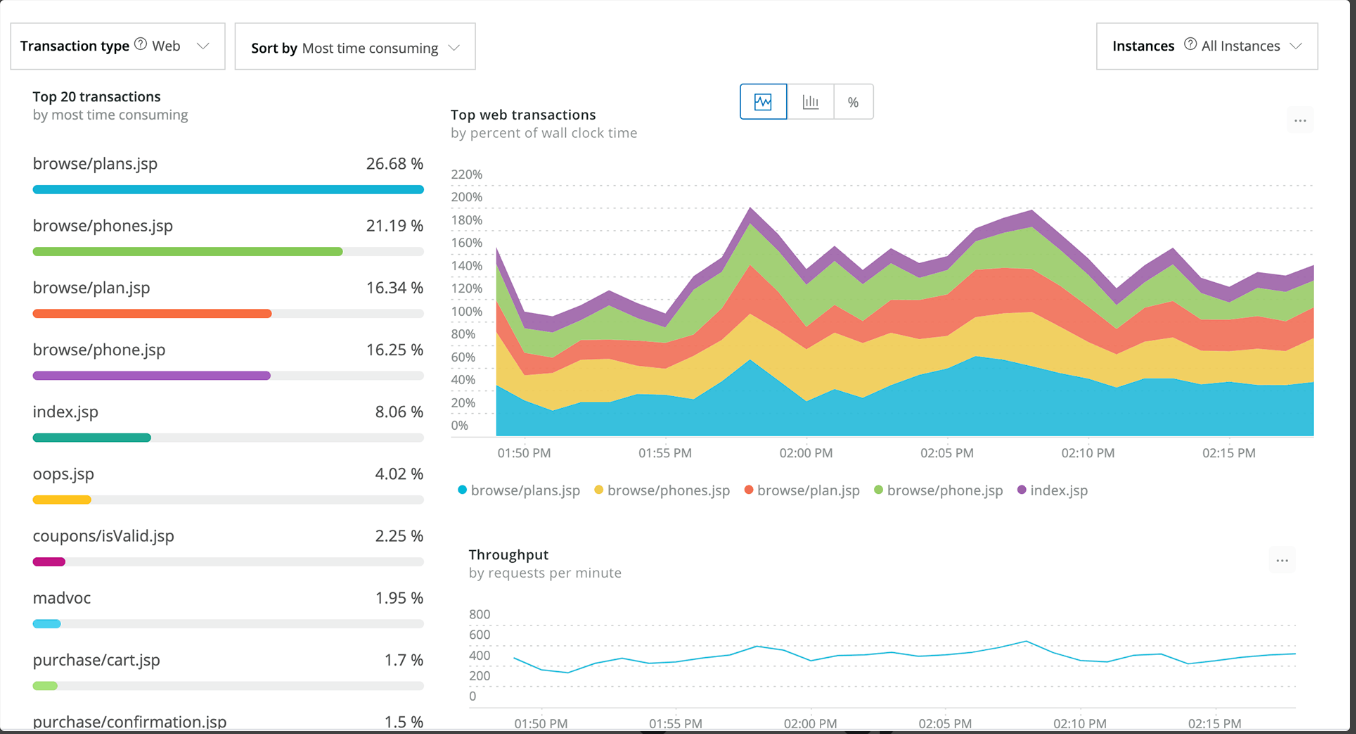
The company decided to implement New Relic APM (Application Performance Monitoring) to gain real-time insights into their application’s performance. New Relic APM offered a comprehensive suite of tools that allowed for end-to-end monitoring of the application stack, enabling the team to identify and resolve performance issues proactively. Leveraging New Relic’s powerful monitoring capabilities, the company could monitor transactions, trace requests across microservices, and analyse dependencies within their complex architecture.
APM stands for “application performance monitoring.” It’s a set of tools and processes used to monitor and optimize the performance of software applications. APM systems can track various metrics, such as response times, resource usage, and error rates.
The implementation involved:
- Deep Dive Monitoring: Utilizing New Relic’s detailed transaction traces and error analytics to pinpoint and resolve performance bottlenecks swiftly.
- Customized Dashboards: Creating personalized dashboards to track specific KPIs and gain actionable insights tailored to the company’s requirements.
- Alerting Mechanisms: Setting up proactive alerts to notify the team instantly about any deviations from predefined performance thresholds, allowing for rapid response and issue resolution.
- Scalability Testing: Using New Relic’s performance data to conduct scalability tests and optimize the application for future growth.
Benefits Delivered
- Enhanced Performance: With detailed insights provided by New Relic, the company could identify and rectify performance bottlenecks, resulting in a more responsive and stable application.
- Improved User Experience: The proactive monitoring and quick issue resolution led to a seamless user experience, reducing instances of downtime and slow response times.
- Cost Efficiency: By optimizing performance and identifying areas for improvement, the company could allocate resources more efficiently, reducing unnecessary expenditure.
- Streamlined Operations: The ability to visualize the entire application stack in real-time allowed for more informed decision-making and streamlined operational processes.
- Future Readiness: Leveraging New Relic’s scalability testing, the platform ensured its readiness to handle increased traffic and user demands, paving the way for future growth without compromising performance.

