
Problem Statement
Before adopting the unified pipeline, the organization faced the following challenges.
- Siloed Data: Data was scattered across various sources, including databases, files, and APIs, impeding a holistic view.
- Manual Data Manipulation: Labor-intensive and error-prone manual processes were required for data extraction, transformation, and loading.
- Limited Accessibility: Users lacked real-time access to consolidated data, hampering informed decision-making.
Solution Overview
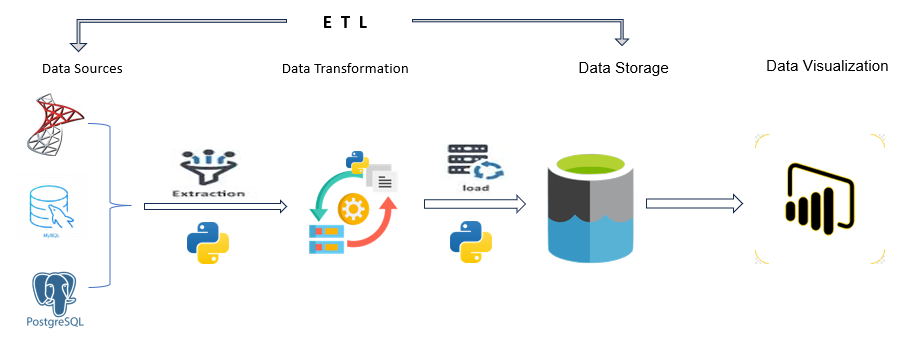
A unified data analytics pipeline was implemented, incorporating the following components
- Data Sources: MSSQL, SQL Server, PostgreSQL databases, files, and APIs.
- Data Extraction: Python scripts efficiently extracted relevant data from each source.
- Data Transformation: Python libraries, such as Pandas, were employed for cleaning and manipulating the extracted data.
- Data Storage: Azure Blob Storage served as temporary storage for transformed data.
- Data Visualization: Power BI was utilized to create interactive dashboards and reports for insightful data representation.
Tech Stack Leveraged
Our tech stack seamlessly combined the power of Python for efficient data extraction and transformation, Azure Blob Storage for temporary storage and scalable data flow, Power BI for dynamic and centralized data visualization, and SQL databases (MySQL, Pg SQL, SQL Server) to address the challenge of siloed data. Python’s Pandas library played a pivotal role in ensuring data consistency, while Azure Blob Storage facilitated a streamlined ETL process. Power BI, with its interactive dashboards, provided a centralized platform for insightful data representation, empowering users with timely and consolidated information.
Benefits Delivered
The unified data analytics pipeline delivered substantial benefits:
- Streamlined Data Flow: Automated extraction and transformation processes eliminated manual manipulation, enhancing efficiency and accuracy.
- Centralized Insights: Power BI dashboards provided a single source of truth for consolidated data analysis.
- Improved Data Quality: Python transformations ensured consistency and integrity across diverse data sources.
- Enhanced Decision-Making: Timely insights facilitated data-driven strategies, contributing to a competitive advantage.
- Reduced Costs: The pipeline eliminated the need for dedicated data infrastructure and manual data management, resulting in cost savings.