
Problem Statement
- Growing data volume from diverse sources: Website traffic logs, customer orders, product information, and marketing campaign data.
- Difficulty analysing data across systems: Siloed data repositories hampered comprehensive insights and business understanding.
- Slow reporting and limited real-time analytics: Existing on-premise data warehouse struggled with responsiveness and scalability.
Solution Overview
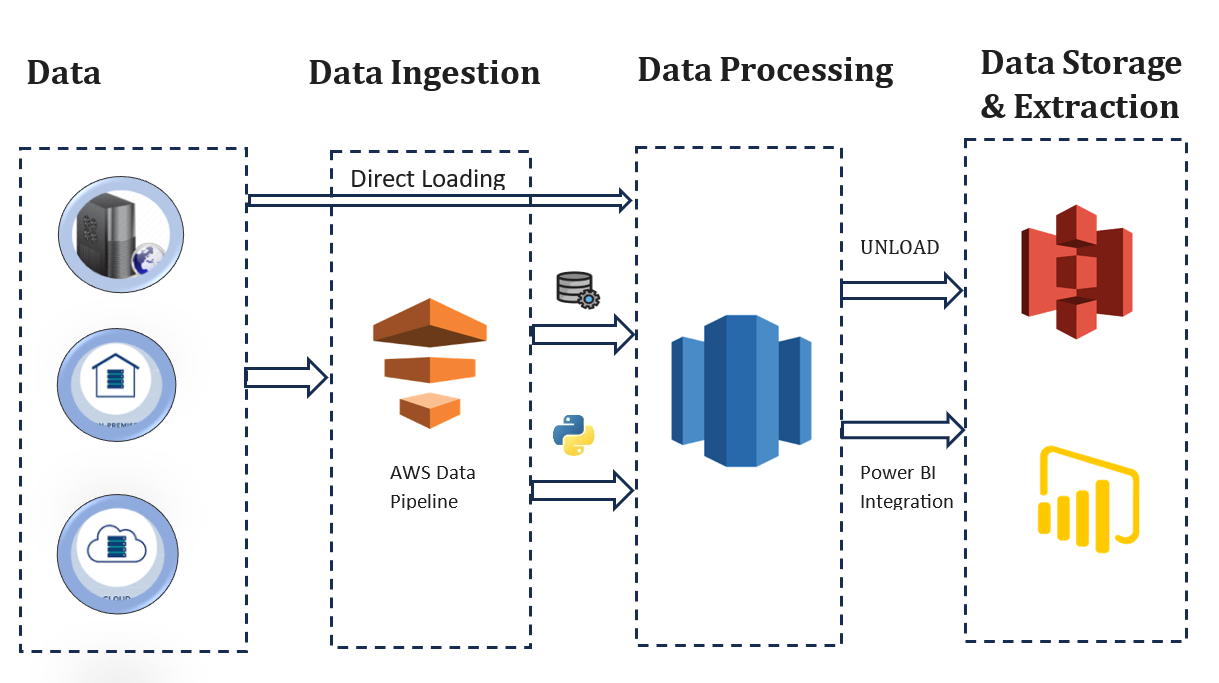
Data Ingestion:
- Implemented the COPY command to directly load data from website logs and CRM system into Redshift, bypassing intermediate storage.
- Utilized AWS Data Pipeline for automated ETL processes, orchestrating data movement from various sources and performing basic transformations.
Data Manipulation and Transformation:
- Leveraged Redshift’s SQL capabilities for filtering, joining, and aggregating data to create consolidated tables for analysis.
- Employed User Defined Functions (UDFs) written in Python to handle complex product category classification and customer segmentation logic.
Data Extraction:
- Used the UNLOAD command to export enriched data to S3 for external analysis with data science tools.
- Integrated Redshift with Power BI for generating interactive dashboards and real-time reports across key metrics like sales, conversion rates, and customer lifetime value.
Tech Stack leveraged
Our tech stack seamlessly integrated Amazon Redshift for real-time analytics, AWS Data Pipeline for automated ETL processes, Python for intricate data transformations through custom UDFs, Power BI for dynamic visualization, and S3 for efficient data extraction. Leveraging Redshift’s SQL capabilities and Python’s flexibility, we tackled challenges from gathering data to delivering insightful results. This comprehensive approach significantly reduced processing time, enhanced operational efficiency, and provided real-time visibility, empowering the organization to make smarter decisions and optimize key aspects of their operations.
Benefits Delivered
- Reduced data processing time by 70%: Faster insights enabled quicker decision-making and campaign optimization.
- Improved operational efficiency by 15%: Data-driven insights led to better inventory management, reduced marketing campaign costs, and enhanced customer service.
- Gained real-time visibility into business performance: Interactive dashboards provided continuous monitoring of key metrics and facilitated immediate response to market trends.