
Problem Statement
In an era marked by dynamic regulatory landscapes and an ever-increasing need for transparency, organizations across industries are compelled to navigate intricate compliance frameworks to ensure ethical business practices and mitigate risk. This case study delves into the development and implementation of a Compliance Overview Dashboard using Tableau, aiming to provide a comprehensive and visually intuitive solution for managing and monitoring compliance metrics. As businesses strive to maintain adherence to a myriad of regulations, standards, and internal policies, the significance of real-time insights cannot be overstated. The Compliance Overview Dashboard presented in this case study serves as a robust tool, leveraging Tableau’s powerful visualization capabilities to streamline the complex process of compliance management. Through a user-friendly interface, it offers stakeholders an unprecedented view into key compliance indicators, facilitating informed decision-making and proactive risk mitigation.
Solution Overview
Our team designed and delivered an interactive compliance dashboard comprising multiple tabs, each offering valuable insights and visualizations to address the client’s compliance needs.
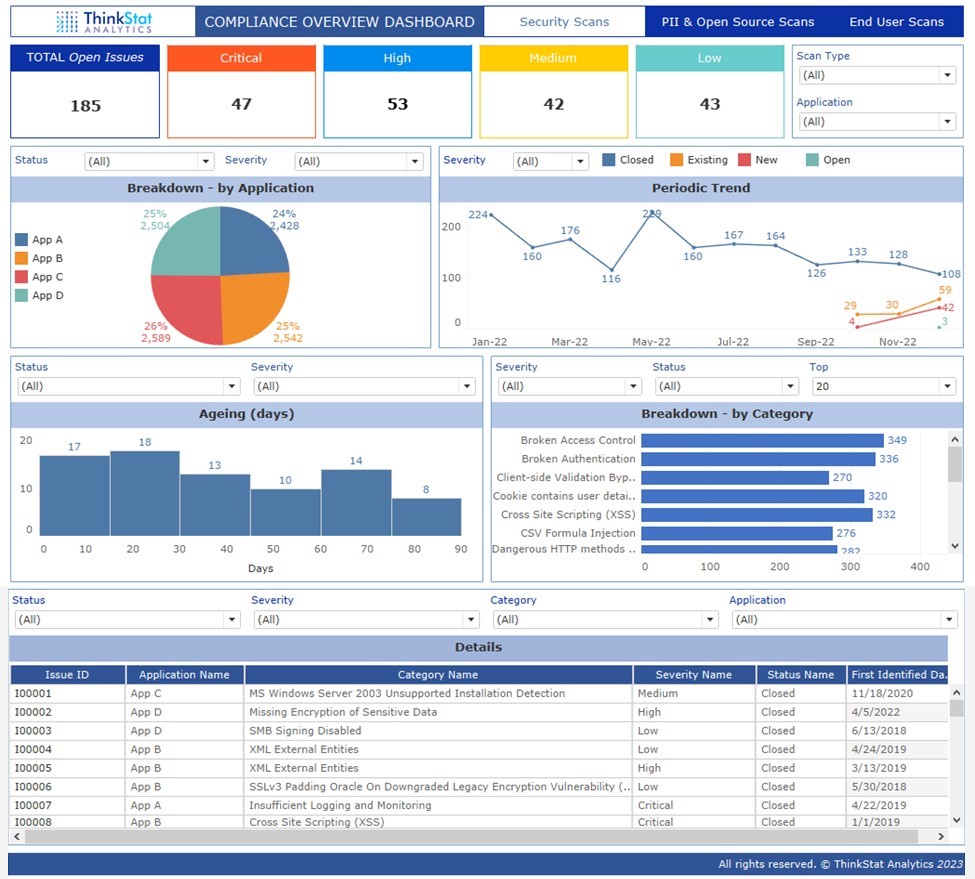
- Security Scans Tab: This provided a detailed breakdown of issues identified through various scan types, including SAST (Static Application Security Testing), WASA (Web Application Security Assessment), and VAPT (Vulnerability Assessment and Penetration Testing). Users could filter the data by scan type or application, empowering them to focus on specific areas of concern.
- Decomposition Tree Tab: This tab utilized a tree diagram to break down open issues by their status, application, and severity. This intuitive visualization helped users explore the underlying factors contributing to compliance issues, enabling targeted remediation actions.
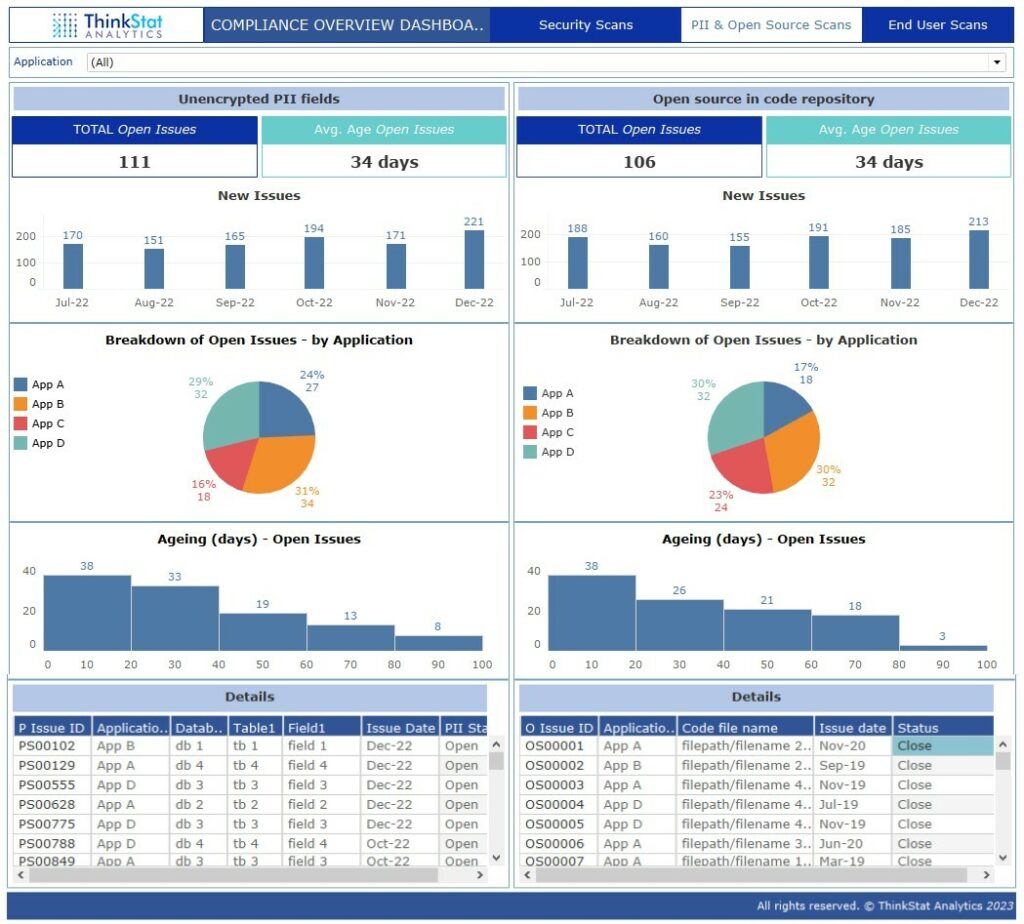
- PII & Open-Source Scans Tab: This tab focused on monitoring compliance issues related to PII and open-source scans. The charts showcased the trend of issues over time, the breakdown of issues by application, and the aging of open issues. These visualizations provided visibility into potential vulnerabilities, facilitating proactive measures to protect sensitive data and mitigate compliance risks.
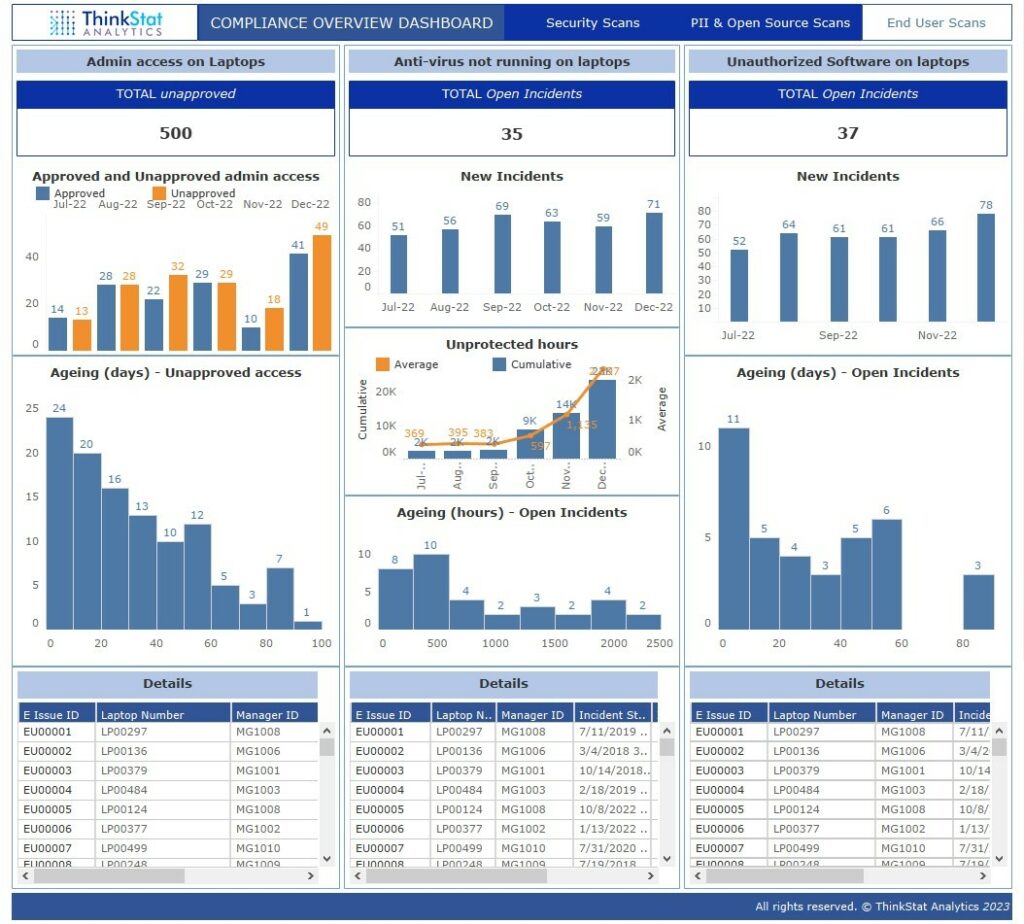
- End User Scans Tab: The tab featured charts and visualizations that showcased the following metrics – Unapproved Admin Access on Laptops, Anti-virus Software Not Running on Laptops, Unauthorized Software on Laptops.
Tech Stack leveraged
Merged data from different sources to create a unified dataset for comprehensive compliance analysis. Established relationships between different data tables to enable meaningful insights in Tableau. Determined the structure of compliance dashboard, considering the key metrics and visualizations needed. Utilized Tableau’s diverse range of charts and graphs to represent data effectively. Created custom calculations or metrics to enhance the analysis. Implemented filters, parameters and actions to make the dashboard interactive and user-friendly. Verified that the data displayed in the dashboard aligns with expectations and is accurate. Validated that filters, actions and other interactive elements function as intended and published the dashboard to make accessible to relevant stakeholders.
Benefits Delivered
The dashboard’s intuitive interface and comprehensive visualizations empowered the client to proactively address compliance issues, mitigate risks, and make informed decisions. With improved compliance monitoring and reporting capabilities, our client can now ensure the security and integrity of their data while meeting regulatory requirements and safeguarding sensitive information.
- Improve collaboration between teams by providing a centralized platform for compliance monitoring and reporting.
- Enhance regulatory compliance and demonstrate due diligence to stakeholders.
- Proactively identify and prioritize remediation efforts based on issue severity and aging.
- The detailed visualization of Open issues, Breakdown by application, Breakdown by category, ageing for open incidents in days provided a comprehensive overview.